Energy industry operators have radically adjusted project planning following the downfall of commodity prices that commenced in 2014. Prices have been rangebound for more than four years, where WTI crude has averaged $52.60 per barrel and natural gas $2.82 per thousand cubic feet. Marginal operators have been forced into bankruptcy and CreditRiskMonitor’s FRISK® score has identified every failure approximately 12 months in advance.
CreditRiskMonitor’s assessment of the U.S./Canadian E&P industry reveals that about two-thirds of operators are financially distressed and have higher-than-average risk of bankruptcy.
The E&P FRISK® Stress Index
For the exploration and production (E&P) evaluation, CreditRiskMonitor has identified 189 U.S. and Canadian-based operators with total assets greater than $20 million. All other oil & gas companies were excluded from the following review, such as: the service providers, pipelines, refineries, and integrated majors (though some of these operations are run by the E&Ps).
The FRISK® score is CreditRiskMonitor’s proprietary credit model that predicts bankruptcy by using a variety of high quality data components including: financial statement ratios, stock market metrics, bond agency ratings, and our proprietary subscriber crowdsourcing (aggregated research of senior risk professionals). This unique methodology has allowed the FRISK® score to achieve a 96% rate of accuracy for all sectors.
As an extension of the FRISK® score, the FRISK® Stress Index provides an overview of financial stress for public companies by measuring risk across any region, industry, or customized portfolio, while using a benchmark factor of 1. E&Ps experienced the most financial distress across all industries and CreditRiskMonitor observed a near eightfold increase in risk between 2014 and 2016, as shown below:
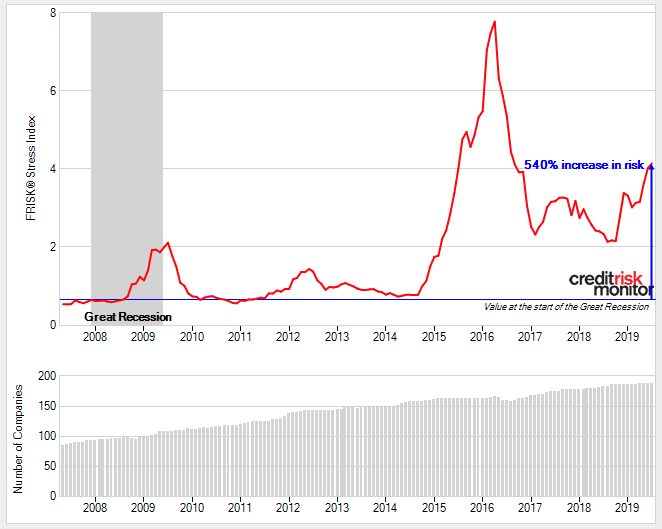
The decline in risk throughout 2016 occurred because of survivorship bias, as a number of companies filed for bankruptcy (displayed by the gray bars). More recently, however, the FRISK® Stress Index has been trending higher and now stands at four times. The underlying drivers of this trend stem from commodity price volatility and increasing cost of capital (relatively higher base interest rates and falling equity valuations).
When digging into these 189 E&Ps further, the distribution shown below is significantly skewed towards high risk. The FRISK® score scale also illustrates the probability of bankruptcy within 12 months:
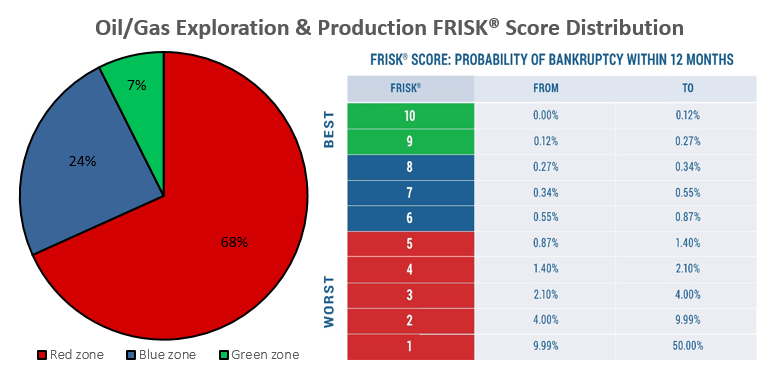
In 2019, more than two-thirds of the companies are financially distressed and have higher-than-average risk of bankruptcy. Otherwise, only one-third maintain a neutral (24%) or strong financial condition (7%). Contextually, the FRISK® score “red zone” corresponds with junk debt and the “green zone” matches investment-grade credit quality.
Debt Coverage Analysis
CreditRiskMonitor evaluated six financial metrics most applicable to these 189 E&P companies. In the examination are median calculations for financial leverage (most recent quarter for total debt-to-total assets and total liabilities-to-tangible net worth) and annualized interest coverage (calculated as trailing 12-month earnings before interest, taxes, depreciation, amortization, and unusual expenses over total interest expenses).
CreditRiskMonitor also identified the proportion of companies that had positive or negative balances on tangible net worth and net working capital in the most recent fiscal quarter. Adjusted operating cash flow for the latest fiscal year also was measured to gauge normalized operating performance. It includes maintenance capital expenditures and excludes growth (or bolt-on acquisition related) capital expenditures. More specifically, this calculation used the most recent annual fiscal period operating cash flow minus depreciation and depletion costs.
| Debt/Assets | Liabilites/Tangible Net Worth | Interest Coverage Ratio | |
| Median | 28% | 87% | 2.83 |
| Tangible Net Worth | Net Working Capital | Adjusted Operating Cash Flow | |
| Positive | 92% | 36% | 63% |
| Negative | 8% | 64% | 37% |
CreditRiskMonitor suspects that many of these independent operators are running not far above cash flow breakeven when considering all costs (e.g. finding, drilling, lifting and SG&A). A majority of companies showed positive adjusted operating cash flow, but the margin remains quite low. From a debt coverage perspective, the median adjusted operating cash flow relative to total outstanding obligations is trending in the mid-single-digits.
Lastly, the share of companies with negative versus positive net working capital underscores weak liquidity and high reliance on short-term debt financing. While this arrangement is an industry standard, it also gives color as to why these operators frequently run low on cash and step into financial restructuring.
High Risk Reports
CreditRiskMonitor creates and publishes High Risk Reports to show various factors that are contributing to a company’s financially distressed condition. Among the five reports that covered independent E&P companies in the last year, two filed for bankruptcy and three maintain the FRISK® score category with the lowest survival rate:
| Company | High Risk Report Issuance | FRISK® Score |
| Bellatrix Exploration Ltd. | June 14, 2019 | 1 |
| Legacy Reserves Inc. | May 13, 2019 | BANKRUPT |
| Ultra Petroleum Corporation | March 21, 2019 | 1 |
| Sanchez Energy Corporation | March 19, 2019 | 1 |
| Jones Energy Inc. | Sept. 28, 2018 | BANKRUPT |
Following the respective issuances of these High Risk Reports, each company soon became involved in bankruptcy or a distressed debt scenario:
- Bellatrix Exploration exchanged debt securities for a combination of new debt and equity
- Legacy Reserves filed for bankruptcy and is working through its restructuring
- Ultra Petroleum has attempted a debt exchange
- Sanchez Energy entered a grace period for a missed monthly interest payment
- Jones Energy filed for bankruptcy restructuring and has since emerged
Bottom Line
The upstream oil & gas industry remains the most distressed, which can present either significant risk or opportunity depending on your company’s positioning within the industry. In 2019, E&Ps appear overleveraged and more companies are trending towards bankruptcy. Certain companies are struggling much more than others, particularly the five aforementioned operators. Contact us if you would like us to stratify the bankruptcy risk of this group.